
At this moment I’m working on a very weird performance issue on our Oracle Universal Content Management database. This is the query (actually with binds of course. Values for dReleaseState and dStatus are the same as far as I could tell from AWR bind history):
SELECT /*+ INDEX( Revisions DRELEASESTATE_REVISIONS ) */ dID
FROM Revisions
WHERE Revisions.dReleaseState = 'N'
AND Revisions.dStatus in ('DONE', 'RELEASED', 'DELETED')
AND Revisions.dInDate<=TO_TIMESTAMP ('2014-10-08 11:44:10.996', 'YYYY-MM-DD HH24:MI:SS.FF')
The thing is: usually it runs in 0.2 seconds. But in some cases it runs in 2-3 minutes. I ran my sqlperf.sql script, expecting to find different execution plans. To my surprise there had only been one plan in the 30 days of AWR history for this query. There was a SQL plan baseline to enforce this. This is the execution plan:
Plan hash value: 1347848516

-------------------------------------------------------------------------------------------------------
| Id  | Operation                   | Name                    | Rows  | Bytes | Cost (%CPU)| Time     |
-------------------------------------------------------------------------------------------------------
|   0 | SELECT STATEMENT            |                         |       |       |     9 (100)|          |
|*  1 |  TABLE ACCESS BY INDEX ROWID| REVISIONS               |   100 |  2900 |     9   (0)| 00:00:01 |
|*  2 |   INDEX RANGE SCAN          | DRELEASESTATE_REVISIONS | 47505 |       |     4   (0)| 00:00:01 |
-------------------------------------------------------------------------------------------------------

Query Block Name / Object Alias (identified by operation id):
-------------------------------------------------------------

   1 - SEL$1 / REVISIONS@SEL$1
   2 - SEL$1 / REVISIONS@SEL$1

Predicate Information (identified by operation id):
---------------------------------------------------

   1 - filter((INTERNAL_FUNCTION("REVISIONS"."DSTATUS") AND
              "REVISIONS"."DINDATE"<=TO_TIMESTAMP(:SYS_B_4,:SYS_B_5)))
   2 - access("REVISIONS"."DRELEASESTATE"=:SYS_B_0)

Column Projection Information (identified by operation id):
-----------------------------------------------------------

   1 - "DID"[NUMBER,22]
   2 - "REVISIONS".ROWID[ROWID,10]

Note
-----
   - SQL plan baseline SQL_PLAN_9apvdeqb4q5kb62ee8c33 used for this statement
Having only one execution plan rules out quite a lot of possibilities. Because, why would the same execution plan have such varying response times. What’s left to think of?
For a while I was thinking about the possibility of row migration issues. Actually, reading from v$sysstat I found quite a lot “table fetch continued rows”. But an analyze soon showed that this table didn’t have those issues.
The only thing I could think of now was wildly varying disk I/O performance. Now, I wouldn’t say the disk I/O performance at our site is ideal, but I just could not imagine it bad enough to make a query go from 0,2 seconds to 200+ seconds. So what was left? I started to sum up the observations for myself and the people involved in the issue:
- The execution plan is fixed with a SQL plan baseline. In AWR history I’ve found only one execution plan for this query.
- We’re running this on a 4 node RAC with physical standby database. Instance parameters are the same on all nodes. 2 nodes are the active ones.
- The query seems to be slow on one instance only. Meanwhile the query is fast on other instances at the same time.
- This can switch at a certain moment and then the query is slow on the node where it previously was fast. I’ve seen the query go slow just a couple of minutes after it was fast. The other way around too. And usually the other instance is then the slow one.
- Query performance doesn’t seem to be related to load on a particular node. Also, I couldn’t find processes capable of flushing all other buffers from the buffer cache.
- The number of consistent gets is 40,000 blocks. Up to 50,000 blocks if really slow.
- The number of rows retrieved by the query is pretty much the same for slow and fast response times.
- When slow, the query does usually 30,000 physical reads and more. When fast it does only 0-100 physical reads (from autotrace statistics and AWR).
- The number of rows in the table have grown only moderately in the last month.
- The index on dReleaseState is actually quite selective. Even without the hint, Oracle uses this execution plan. Not that matters much, because it can run in 0.2 seconds.
- Memory of all instances has been enlarged on October 2nd to 10 GB. Half of it is buffer cache.
- If you plot response time against disk reads (from dba_hist_sqlstat), you get a strange kink in the graph. Same for CPU usage by the way, allthough CPU hasn’t been used much.
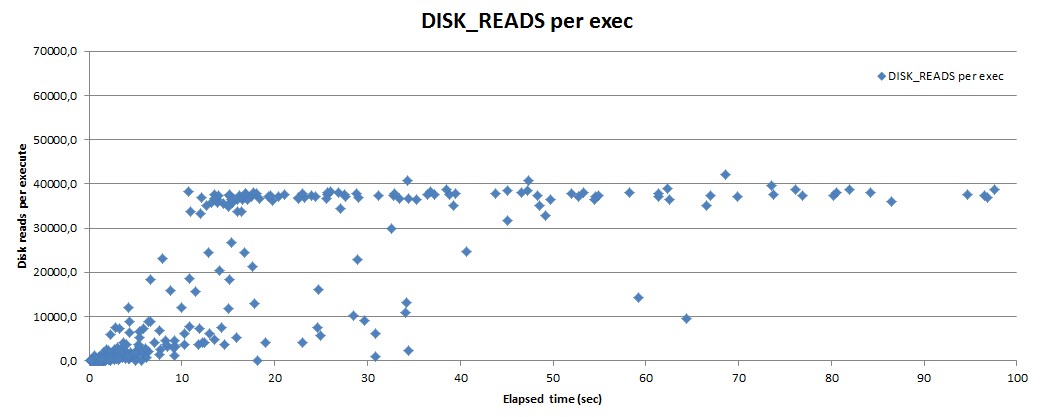
Response time against disk reads for a query with wildly varying response times.
Well, there you have it. What I really want to know is what’s behind this. I’ve had many suggestions on improving the execution plan (including from Oracle Support), but that’s not what I’m after.
Is it a bug? Did we do something stupid? Whatever the cause, I’m really curious what the issue is. I’ll promise I’ll blog about it when I know.
[Update October 25th]
Two collegues mentioned this problem probably has something to do with remastering. I have never heard of this term, but I’ve understood that it is a problem that can occur in RAC clusters. I’ll read into it and come back as soon as I’ve understand this issue.
[Update March 5th 2015]
Unfortunately I never got to find out what the issue was. Very likely it had to do with remastering. My collegues decided to run the job that had these issues on just one instance and the issue never came up. Meanwhile I didn’t get time to fully investigate further. It was all a bit unsatisfying.

Hi Marcel-Jan,
I would recommend to post your “mystery” to “http://www.freelists.org/webpage/oracle-l”.
It will be highly visible.
Oleg
Hello Marcel-Jan,
did you ever find the problem (or a solution) ?
Regards,
Marcel
Good that you mention it. I’ve written another update. Unfortunately I could not solve this one. My collegues connected the job with just one instance as a workaround. I was asked to do other tasks and I had to let this be.
Ok, well thanks for the reply. Let’s see if I can get more out of Oracle support 🙂
It was very confusing dealing with Oracle Support on this one. They kept wanting to change the execution plan.
Have a look at https://jonathanlewis.wordpress.com/2009/11/12/no-change/ It is a quite comprehensive list of possible causes for your case as well.